AI Data Visualization Course is designed to help learners transform raw data into meaningful, interactive, and visually compelling insights using modern data visualization techniques and AI-powered tools. The course covers the complete visualization workflow, from data preparation and analysis to dashboard creation, storytelling, automation, and AI-assisted insights.
Module 1: Introduction to AI & Data Visualization
Introduction to Data Visualization
Understanding AI and its role in data visualization
The Hands-On AI Data Visualization Projects are designed to provide practical experience in transforming raw datasets into meaningful visual insights using AI-powered analytics and visualization tools. These projects help learners apply concepts such as data cleaning, exploratory data analysis, AI-assisted insights, interactive dashboards, KPI analysis, and data storytelling. Each project focuses on a real-world business scenario, enabling learners to develop practical skills and create portfolio-ready projects.
AI-Powered Sales & Revenue Dashboard
Build an interactive AI-powered Sales & Revenue Dashboard to analyze sales performance, revenue trends, product performance, customer segments, and regional sales.
AI-Based Customer & Marketing Analytics Dashboard
Develop an AI-Based Customer & Marketing Analytics Dashboard to understand customer behavior, marketing performance, campaign effectiveness, and customer segmentation.
AI-Powered Business Performance & Forecasting Dashboard
Create an AI-Powered Business Performance & Forecasting Dashboard that helps organizations monitor business KPIs, identify trends, and support data-driven decision-making.
For Corporates
Educate your workforce with new skills to improve their performance and productivity.
Corporate Training
Customised training with customised curriculum to meet the requirements of your workforce
Diversified learning models Live online training, Self-paced videos, On-premises training, and Classroom training
Dedicated lab setup with software installation, evaluation reports of employees, and study material with video recoding
We have a diverse pool of skilled instructors from numerous industries, ensuring the best fit for your customised requirements
Track and measure the impact of training on individuals and teams with our evaluation performance report
Mr. Rajesh, an AI Data Visualization Specialist with 12+ years of industry experience, brings extensive expertise in data analytics, AI-powered visualization, dashboard development, and business intelligence. His practical, industry-focused training approach helps learners understand complex data concepts easily and apply them to real-world projects using modern visualization tools and AI techniques.
The AI Data Visualization Course is designed to help learners develop practical skills in transforming raw and complex data into meaningful visual insights using modern visualization tools and AI technologies. The course focuses on data analysis, interactive dashboards, AI-assisted insights, and real-world business applications.
What is the main objective of the AI Data Visualization Course?
The main objective is to teach learners how to analyze data and create meaningful visualizations. It also helps them use AI to generate insights and improve data-driven decision-making.
Who can join the AI Data Visualization Course?
Students, data analysts, business professionals, developers, and beginners interested in data visualization can join. Basic knowledge of computers and data concepts is helpful but not mandatory.
What tools will I learn in this course?
Learners can gain practical exposure to tools such as Power BI, Tableau, Excel, Python, and AI-powered visualization tools. This training focuses on using these tools for real-world data analysis and dashboard development.
Will I work on real-world AI Data Visualization projects?
Yes, the course includes hands-on projects based on practical business scenarios. Learners can create interactive dashboards, analyze trends, and generate AI-assisted insights.
What career skills will I gain after completing the course?
You will develop skills in data visualization, dashboard development, AI-assisted analytics, and data storytelling. These skills can support careers in data analytics, business intelligence, and visualization roles.
Job Assistance Program
Our Job Assistance Programme offers you special guidance through the course curriculum and helps in your interview preparation.
Specialised Curriculum
Get on-field knowledge and skills from our expert instructors.
Assessment
Upgrade your on-field skills with our assessments and track your progress in real time.
Hands-on Project
Our hands-on project help you gain experience in real-time working.
Certification Guidance
A global certificate always helps you stand out from the crowd.
Portfolio Building
Experts guide you to maximise your profile with current industry trends that employers expect.
Placment Cell
We promote your abilities and showcase your portfolio to employers.
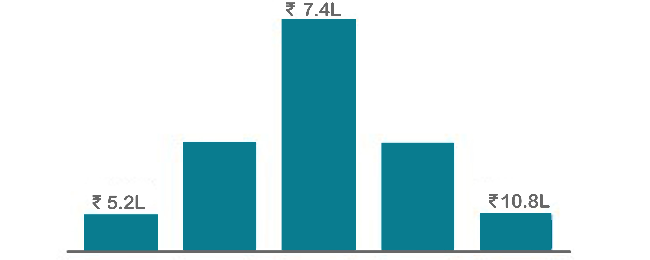
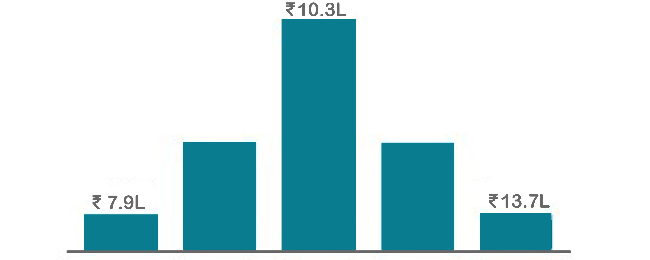
AI Data Visualization offers exciting career opportunities as businesses increasingly rely on data-driven decision-making. Learners can explore roles such as Data Visualization Analyst, BI Analyst, Data Analyst, Dashboard Developer, and AI Data Analyst across various industries.
Annual Pay Scale
Employers
Annual Salary
Hiring Companies
Placement Guidance & Interview Preparation
Infibee’s placement guidance navigates you to your desired role in top organisations, ensuring you stand out and excel in every opportunity.
Resume Enhancement: Updating and enhancing your resume to effectively highlight your abilities, experience, and accomplishments.
Mock Interviews: Practice real-life interviews with feedback to fine-tune your responses, boost confidence, and reduce anxiety.
Industry Insights: Stay informed about industry trends, company culture, and expectations to excel in interviews.
Job Portal Updation: Update or create your profile in job portals with our guidance and listing of key words for your preferred designation.
Customized Preparation: Targeted preparation for specific job roles, ensuring you are well-prepared for role-specific questions.
Interview Strategies: Comprehensive coaching on interview techniques and communication skills to ace any interview.
Confidence Building: Boosting self-assurance and equipping you with the mindset needed to excel during interviews.
Online Presence: Optimizing your online presence, including LinkedIn profiles and social media, to align with your career goals.
Posted on Google
Vaishnavi M
Trustindex verifies that the original source of the review is Google.
I enrolled in the Workday HCM Payroll course at Infibee Technologies and I am fully satisfied with the training. The classes were easy to understand and the placement guidance together with mock interviews helped me build trust in my abilities. Job seekers should consider this program because it comes with high recommendations.
Posted on Google
Subhashiniwillams075
Trustindex verifies that the original source of the review is Google.
I enrolled in the SAP ANALYTICS CLOUD course at Infibee Technologies and the classes were very well structured. The trainers possess industry experience and they delivered effective assistance with both resume creation and job placement services. This institution serves as the topmost educational center for SAP training courses.
Posted on Google
Deva Dharshini
Trustindex verifies that the original source of the review is Google.
I recently completed the SAP CO-PA course at Infibee Technologies and had a great experience. The training quality was excellent, and the trainers were friendly, knowledgeable, and very supportive.
They also provided valuable help with interview preparation and resume building, which boosted my confidence. With affordable fees and strong support, I highly recommend this institute for SAP training.
Posted on Google
Arivu Vaisi
Trustindex verifies that the original source of the review is Google.
The Oracle Flexcube course at Infibee Technologies provided me with practical knowledge through its educational sessions. The trainer explained all concepts clearly and the placement support was very helpful. The program provides excellent Oracle training according to my assessment.
Posted on Google
Vishva raja
Trustindex verifies that the original source of the review is Google.
The SAP IBP Course training is excellent. Trainers are knowledgeable and guide students with real-time scenarios. Placement support and resume preparation are very good. Highly recommended!
Posted on Google
Harish
Trustindex verifies that the original source of the review is Google.
I learned SAP FSCD Course at Infibee Technologies and it was very helpful. Trainers provide real-time examples and excellent placement support. Highly recommended institute!
Posted on Google
Marudhu
Trustindex verifies that the original source of the review is Google.
I completed the MS DYNAMICS 365 CRM course at Infibee Technologies and found the training to be very beneficial. The course was explained in an easy way and the placement guidance gave me more confidence. I highly recommend joining this program at the present time.
Posted on Google
Nandhini Akash
Trustindex verifies that the original source of the review is Google.
I completed the Workday HR course at Infibee Technologies and the training was really helpful for my career growth. The trainers support students by providing simple explanations which include real-world examples of every topic. Highly recommended to join now.
I joined Infibee in order to take a Data Science Course.
Being from a non-IT background, I believe that being an IT Professional will be difficult for me. But now I believe that joining Infibee is the best decision I've ever made. My overall experience has been excellent. The teaching and non-teaching staff are both excellent. I will never forget the experience I had with Infibee. Thank you for your help and support, Infibee.
Muthu krishnan
I graduated without an IT background, but Infibee has helped me advance my career as a data scientist. Here, mentors are very helpful. With the right guidance and dedication, you can achieve your dreams. Self-study is also crucial if you want to stand out from the crowd and seize your opportunities.Companies frequently visit Infibee for placements and take some incredible talent with them.
Pranali
I enrolled in Infibee's PG Data Science course. The training experience was excellent, with 80% practical training and 20% theory, which was extremely beneficial. I learned a great deal. My placement process began after I completed my course, and I am now working as an RPA and Data Science Intern at rsutra. Nisha Mam was extremely helpful during the placement process.
Yuvaraj
The courses on Infibee are excellent. It has great value. I was non IT person and joined for Data Science course it was really helpful and interesting learning with Infibee. Teachers are also incredible they did an excellent job of ensuring that we understood each concept. Excellent job setting up the mock test and interview. I enjoyed finding more skill out of me from Infibee.I appreciate Infibee's assistance in advancing my career.
Lavanya
I completed Full Stack Development Course at infibee. Infibee is the best training institute. My trainer taught us the best concepts out there. His teaching skills are great. They are having lots of knowledge. The way of teaching is also good. I am satisfied with the course. Glad to have found this institute.
Madhaiyan Madhan
AI Data Visualization Training FAQ's
Infibee AI Data Visualization Course offers wide range of services that suits for both fresher and experienced persons via both offline and online at your suitable time slots.
What if I Miss a Class ?
You need not worry about having missed a class. Our dedicated course coordinator will help them with anything and everything related to administration. The coordinator will arrange a session for the student with trainers in place of the missed one.
Will I get a Free Demo?
Yes, of course. You can contact our team at Infibee Technologies, and we will schedule a free demo or a conference call with our mentor for you.
What are the Modes of Training in Infibee ?
We provide classroom, online, and self-based study material and recorded sessions for students based on their individual preferences.
Are the trainers at Infibee Technologies experienced in the industry?
Yes, all our trainers are industry professionals with extensive experience in their respective domains. They bring hands-on practical and real-world knowledge to the training sessions.
Can I access course materials after the training is complete?
Yes, participants typically receive access to course materials, including recorded sessions, assignments, and additional resources, even after the training concludes.
Do you offer placement assistance?
We provide placement assistance to students, including resume building, interview preparation, and job placement support for a wide range of software courses.
Do you offer customized training for corporate clients?
Yes, we offer customisation of the syllabus for both individual candidates and corporate also.
Can companies or organizations inquire about group training for their employees?
Yes, we offer corporate training solutions. Companies can contact us for customised programmes tailored to their team’s needs.
What technical requirements are needed to participate in live online training sessions?
Participants need a stable internet connection and a device (computer, laptop, or tablet) with the necessary software installed. Detailed technical requirements are provided upon enrollment.
Can I switch from self-paced to live online training or vice versa during the course?
In most cases, such requests can be accommodated. Participants can reach out to our support team to discuss their preferences and explore available options.
People Also Refer To Similar Courses
We offer courses that help you improve your skills and find a job at your dream organisations.
SAP AFS Classes in Magarpatta
26547
40 HRS
Intermediate
Rated 5 out of 5
SAP GRC Access Control Classes in Magarpatta
16477
40 HRS
Intermediate
Rated 5 out of 5
SAP Workflow Classes in Magarpatta
25547
50 HRS
Intermediate
Rated 5 out of 5
SAP EWM Classes in Magarpatta
16476
60 HRS
Intermediate
Rated 5 out of 5
Other Courses
Courses that are designed to give you top-quality skills and knowledge.